 Recorder Mode 🔴/⏺️
 <p>(Watch the tutorial on YouTube)</p>
🔴 SeleniumBase Recorder Mode lets you record & export browser actions into test automation scripts.

⏺️ Recorder Mode can be activated from the command-line interface or the Recorder Desktop App.
⏺️ To make a new recording from the command-line interface, use sbase mkrec, sbase codegen, or sbase record:
sbase mkrec TEST_NAME.py --url=URL
If the file already exists, you’ll get an error. If no URL is provided, you’ll start on a blank page and will need to navigate somewhere for the Recorder to activate. (The Recorder captures events on URLs that start with https, http, or file.) The command above runs an empty test that stops at a breakpoint so that you can perform manual browser actions for the Recorder. When you have finished recording, type “c” on the command-line and press [ENTER] to continue from the breakpoint. The test will complete and a file called TEST_NAME_rec.py will be automatically created in the ./recordings folder. That file will get copied back to the original folder with the name you gave it. (You can run with Edge instead of Chrome by adding --edge to the command above. For headed Linux machines, add --gui to prevent the default headless mode on Linux.)
Example:
sbase mkrec new_test.py --url=wikipedia.org

* RECORDING initialized: new_test.py

pytest new_test.py --rec -q -s --url=wikipedia.org

>>>>>>>>>>>>>>>>>> PDB set_trace >>>>>>>>>>>>>>>>>

> PATH_TO_YOUR_CURRENT_DIRECTORY/new_test.py(9)
   .
   5         def test_recording(self):
   6             if self.recorder_ext:
   7                 # When done recording actions,
   8                 # type "c", and press [Enter].
   9  ->             breakpoint()
 return None
(Pdb+) c

>>>>>>>>>>>>>>>>>> PDB continue >>>>>>>>>>>>>>>>>>

>>> RECORDING SAVED as: recordings/new_test_rec.py
**************************************************

*** RECORDING COPIED to: new_test.py
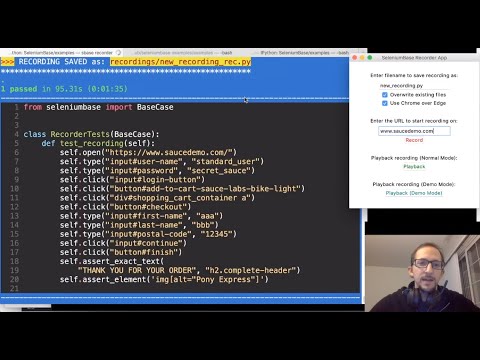
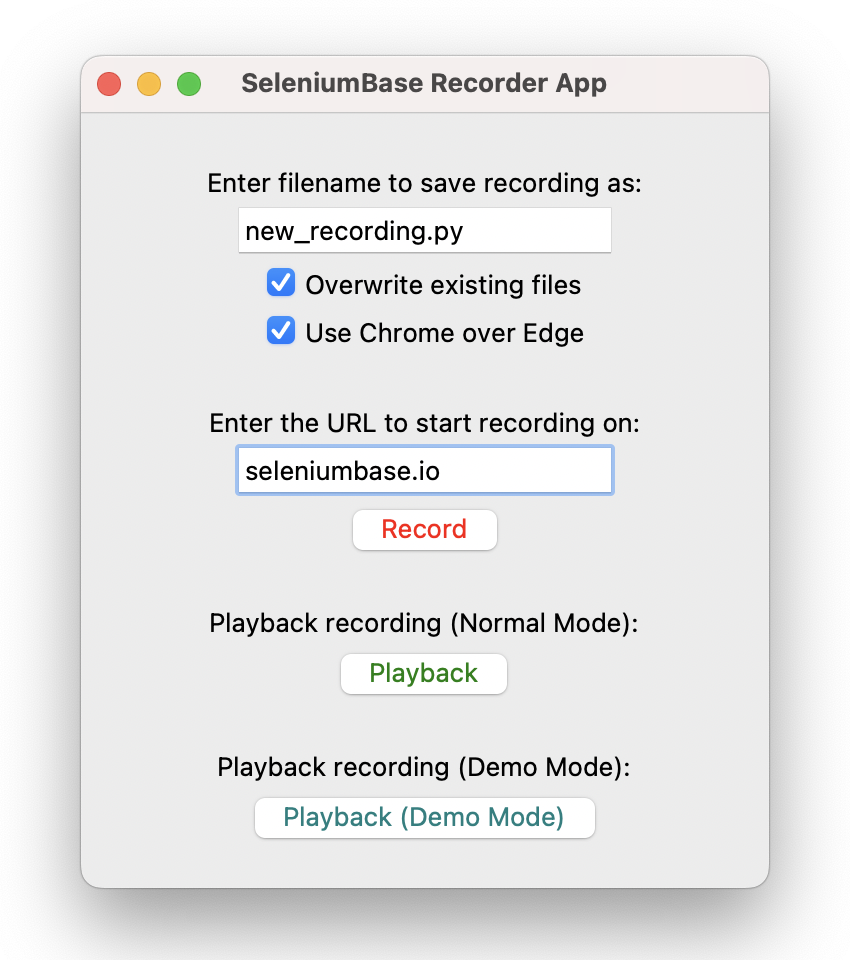
🔴 You can also activate Recorder Mode from the Recorder Desktop App:
sbase recorder
* Starting the SeleniumBase Recorder Desktop App...

⏺️ While a recording is in progress, you can press the [ESC] key to pause the Recorder. To resume the recording, you can hit the [~`] key, which is located directly below the [ESC] key on most keyboards.
⏺️ From within Recorder Mode there are two additional modes: “Assert Element Mode” and “Assert Text Mode”. To switch into “Assert Element Mode”, press the [^]-key (SHIFT+6 on standard QWERTY keyboards): The border will become purple, and you’ll be able to click on elements to assert from your test. To switch into “Assert Text Mode”, press the [&]-key (SHIFT+7 on standard QWERTY keyboards): The border will become teal, and you’ll be able to click on elements for asserting text from your test.
⏺️ While using either of the two special Assertion Modes, certain actions such as clicking on links won’t have any effect. This lets you make assertions on elements without navigating away from the page, etc. To add an assertion for buttons without triggering default “click” behavior, mouse-down on the button and then mouse-up somewhere else. (This prevents a detected click while still recording the assert.) To return back to the original Recorder Mode, press any key other than [SHIFT] or [BACKSPACE] (Eg: Press [CONTROL], etc.). Press [ESC] once to leave the Assertion Modes, but it’ll stop the Recorder if you press it again.
⏺️ For extra flexibility, the sbase mkrec command can be split into four separate commands:
sbase mkfile TEST_NAME.py --rec

pytest TEST_NAME.py --rec -q -s

sbase print ./recordings/TEST_NAME_rec.py -n

cp ./recordings/TEST_NAME_rec.py ./TEST_NAME.py
The first command creates a boilerplate test with a breakpoint; the second command runs the test with the Recorder activated; the third command prints the completed test to the console; and the fourth command replaces the initial boilerplate with the completed test. If you’re just experimenting with the Recorder, you can run the second command as many times as you want, and it’ll override previous recordings saved to ./recordings/TEST_NAME_rec.py. (Note that -s is needed to allow breakpoints, unless you already have a pytest.ini file present where you set it. The -q is optional, which shortens pytest console output.)
⏺️ You can also use the Recorder to add code to an existing test. To do that, you’ll first need to create a breakpoint in your code to insert manual browser actions:
breakpoint()
Now you’ll be able to run your test with pytest, and it will stop at the breakpoint for you to add in actions: (Press c and ENTER on the command-line to continue from the breakpoint.)
pytest TEST_NAME.py --rec -s
⏺️ You can also set a breakpoint at the start of your test by adding --trace as a pytest command-line option: (This is useful when running Recorder Mode without any pdb breakpoints.)
pytest TEST_NAME.py --trace --rec -s
⏺️ After the test completes, a file called TEST_NAME_rec.py will be automatically created in the ./recordings folder, which will include the actions performed by the test, and the manual actions that you added in.
⏺️ Here’s a command-line notification for a completed recording:
>>> RECORDING SAVED as: recordings/TEST_NAME_rec.py
***************************************************
⏺️ When running additional tests from the same Python module, Recordings will get added to the file that was created from the first test:
>>> RECORDING ADDED to: recordings/TEST_NAME_rec.py
***************************************************
⏺️ Recorder Mode works by saving your recorded actions into the browser’s sessionStorage. SeleniumBase then reads from the browser’s sessionStorage to take the raw data and generate a full test from it. Keep in mind that sessionStorage is only present while the browser tab remains in the same domain/origin. (The sessionStorage of that tab goes away if you leave that domain/origin.) To compensate, links to web pages of different domain/origin will automatically open a new tab for you in Recorder Mode.
⏺️ Additionally, the SeleniumBase self.open(URL) method will also open a new tab for you in Recorder Mode if the domain/origin is different from the current URL. If you need to navigate to a different domain/origin from within the same tab, call self.save_recorded_actions() first, which saves the recorded data for later. When a recorded test completes, SeleniumBase scans the sessionStorage data of all open browser tabs for generating the completed script.
⏺️ As an alternative to activating Recorder Mode with the --rec command-line arg, you can also call self.activate_recorder() from your tests. Using the Recorder this way is only useful for tests that stay on the same URL. This is because the standard Recorder Mode functions as a Chrome extension and persists wherever the browser goes. (This version only stays on the page where called.)
⏺️ (Note that same domain/origin is not the same as same URL. Example: https://xkcd.com/353 and https://xkcd.com/1537 are two different URLs with the same domain/origin. That means both URLs share the same sessionStorage, and that changes persist to different URLs of the same domain/origin. If you want to find out a website’s origin during a test, just call: self.get_origin(), which returns the value of window.location.origin from the browser’s console.)
⏺️ Inside recorded tests, you might find the self.open_if_not_url(URL) method, which opens the URL given if the browser is not currently on that page. SeleniumBase uses this method in recorded scripts when the Recorder detects that a browser action changed the current URL. This method prevents an unnecessary page load and shows what page the test visited after a browser action.
⏺️ By launching the Recorder App with sbase recorder --ee, you can end the recording by pressing {SHIFT+ESC} instead of the usual way of ending the recording by typing c from a breakpoint() and pressing Enter. Those buttons don’t need to be pressed at the same time, but SHIFT must be pressed directly before ESC.
⏺️ Use sbase recorder --uc to launch the Recorder App with UC Mode enabled. (The driver will be disconnected from Chrome, but the Recorder extension will still capture any browser actions.)

